The query editor is where you write and run queries against any connected database: SQL for PostgreSQL, MySQL, and SQLite; shell-style queries for MongoDB; and commands for Redis.
Open an editor
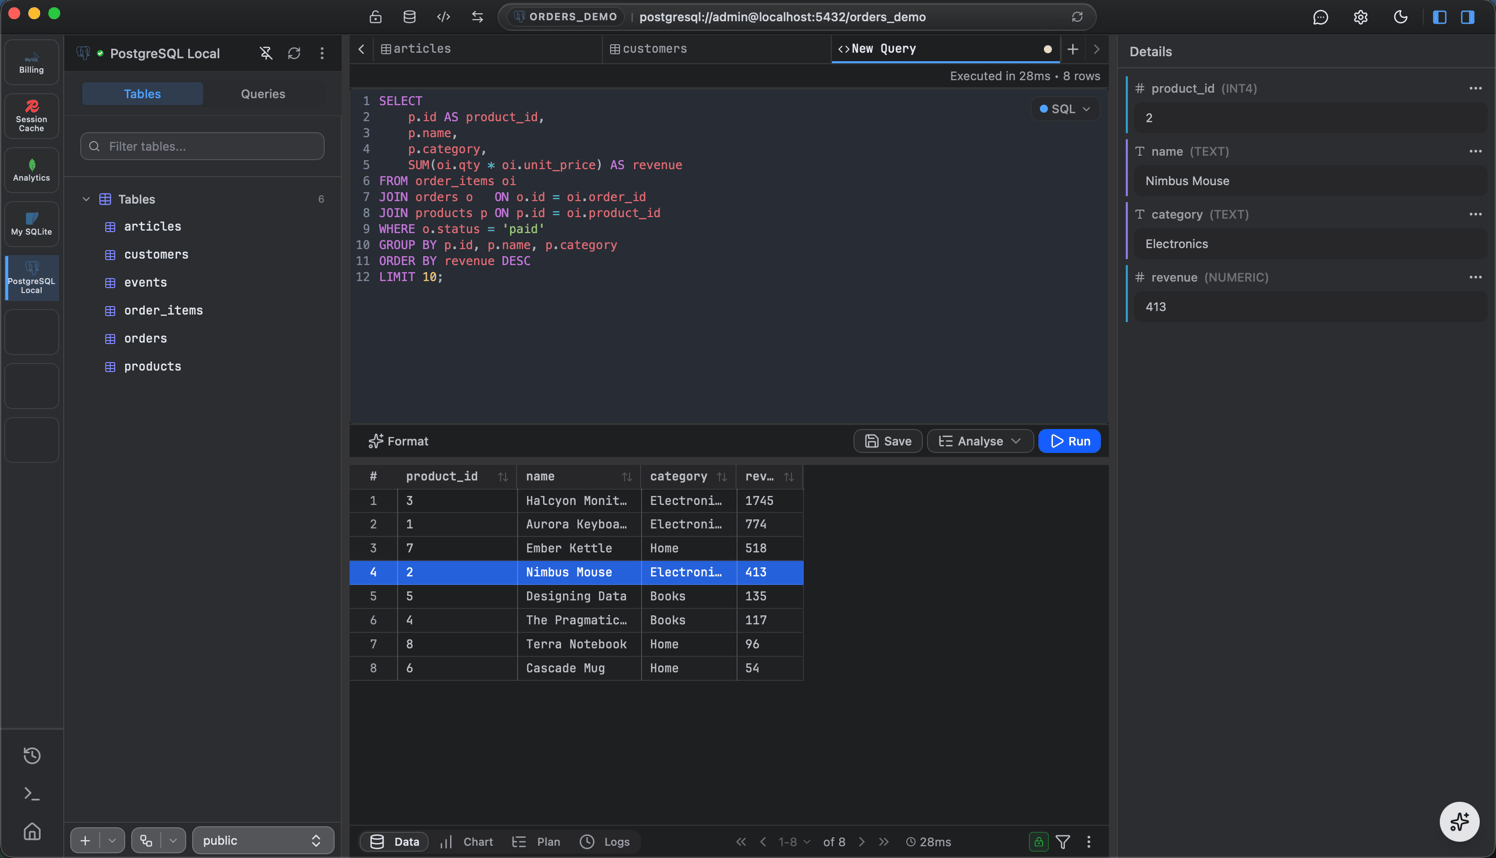
Click + in the tab bar and choose New Query, or use the query icon in the sidebar. The editor knows which connection and database the tab targets, shown in the footer.
Write with autocomplete
As you type, FlexTable suggests tables, columns, and keywords from the live schema.
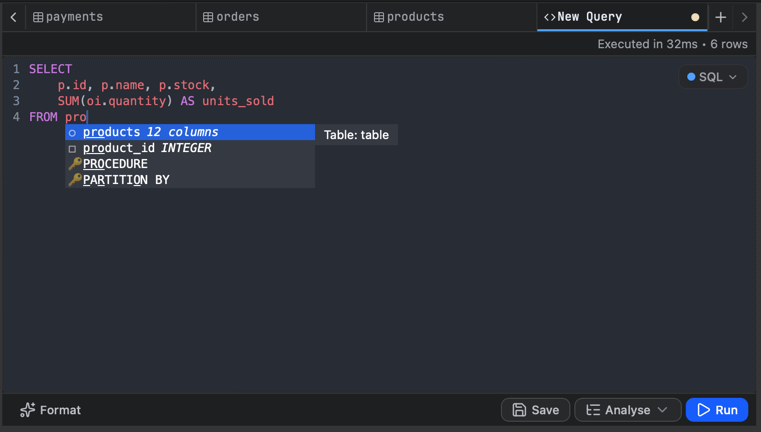
Schema-aware. Suggestions come from the database you are actually connected to, so table names, column names, and types are real.
Run and read results
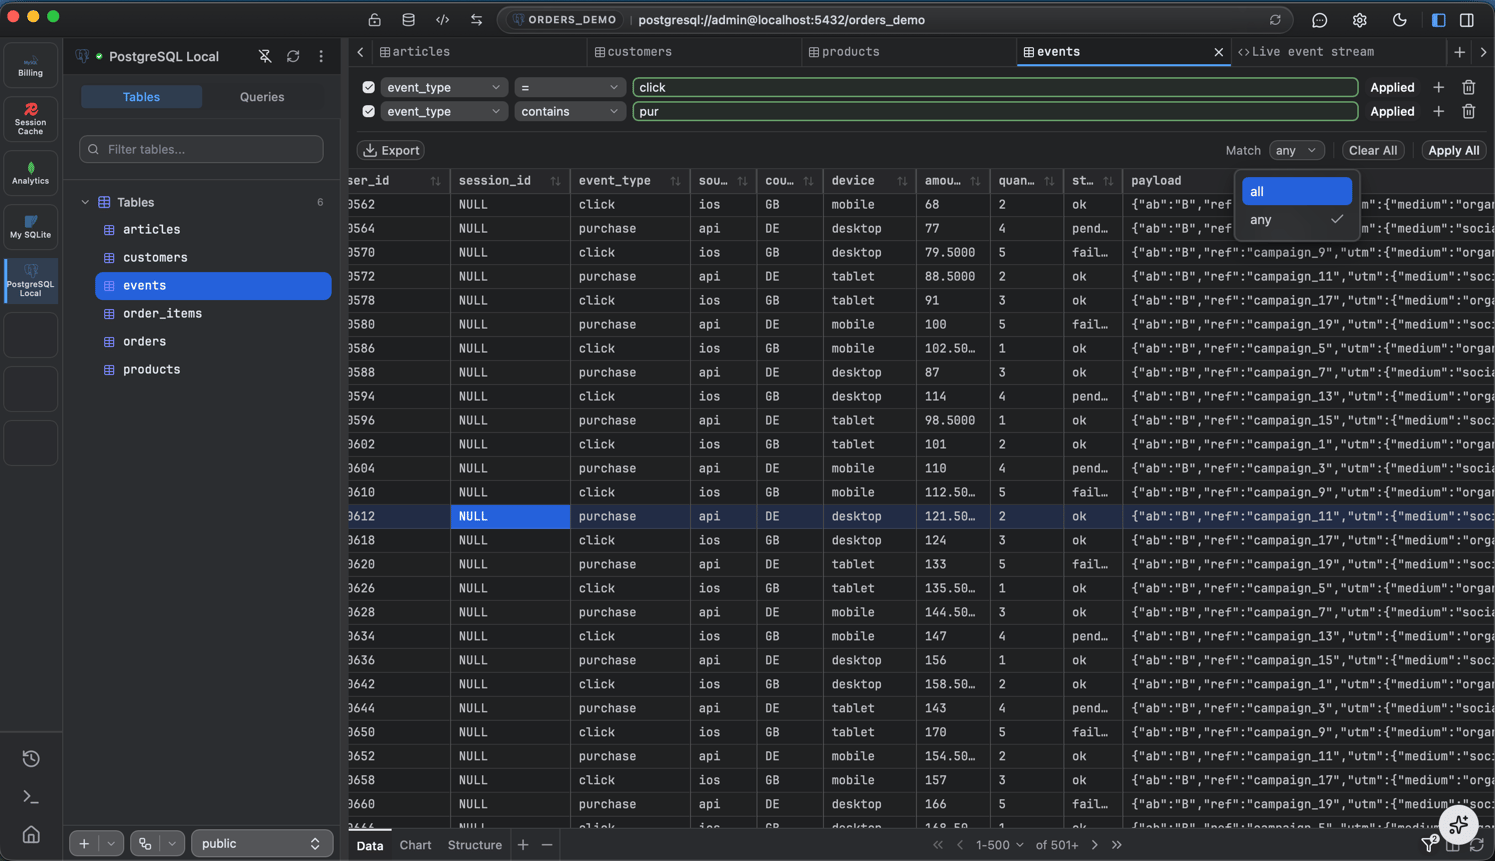
Press Cmd/Ctrl + Enter (or the Run button) to execute. Results stream into the grid below and large results paginate. The result grid is the same one used for table browsing, so you can sort, filter, and inspect a cell just like a table.
Cancellable. A long-running query can be stopped; the Run button becomes Stop while it executes.
Saved queries and history
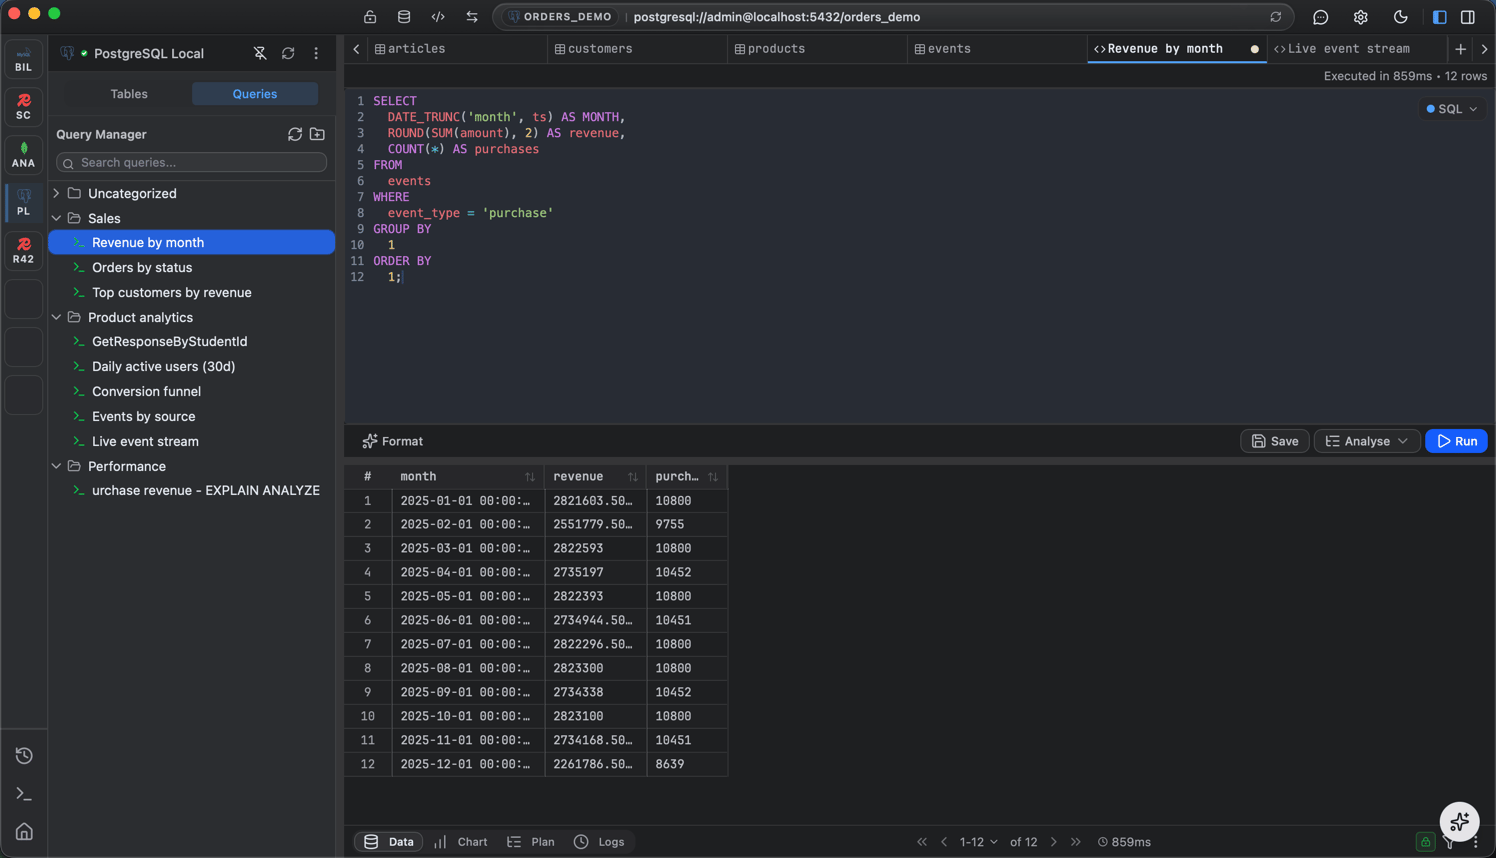 Two separate things:
- Saved queries - name and save a query, organize saved queries into folders, and reopen them later. Save with Cmd/Ctrl + S or the Save action in the editor.
- Run history - every query you run is logged automatically, separate from saved queries, with its status, duration, rows affected, and timestamp. Open the history view (grouped by date) to copy, re-run, or reopen a past query.
Visualize and export
- Chart - switch the result from Table to Chart to see it as a bar, line, area, pie, or scatter chart. See Charts.
- Export - save the result as CSV, JSON, SQL, or Excel. See Import and export.
Logs
The footer Logs tab shows execution details (timing and errors) for the queries you have run. 
