> ## Documentation Index
> Fetch the complete documentation index at: https://docs.flextable.dev/llms.txt
> Use this file to discover all available pages before exploring further.
# Query editor
> Write, autocomplete, and run queries; then read, filter, chart, and export the results.
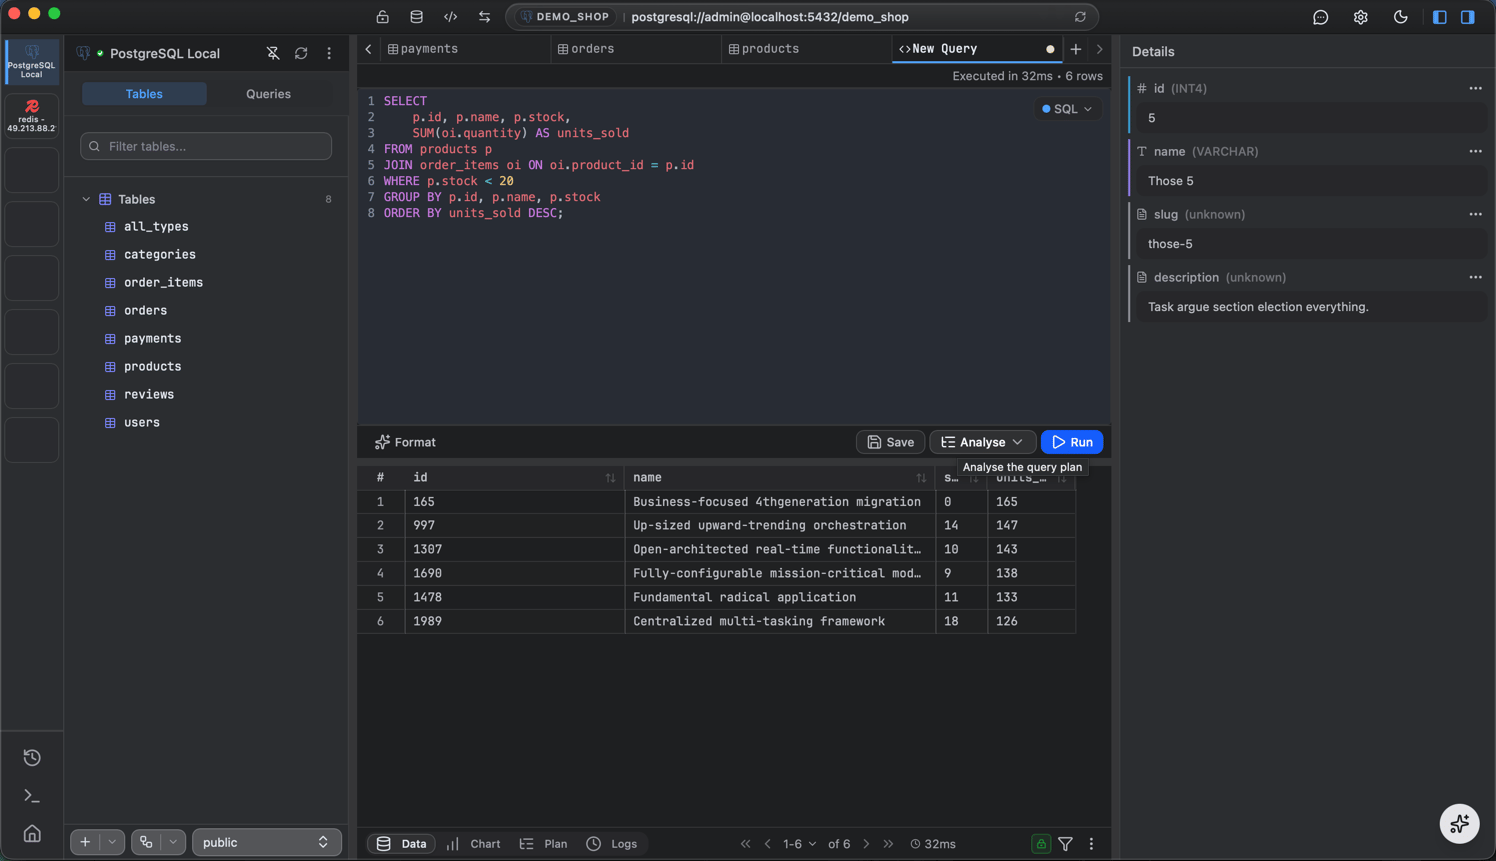
The query editor is where you write and run queries against any connected database: SQL for PostgreSQL, MySQL, and SQLite; shell-style queries for MongoDB; and commands for Redis.
 **PRO for NoSQL queries.** Running typed queries against **MongoDB and Redis** requires a PRO license. Browsing those databases (keys, documents, collection data) is always free. SQL databases run queries for free.
## Open an editor
Click **+** in the tab bar and choose **New Query**, or use the query icon in the sidebar. The editor knows which connection and database the tab targets, shown in the footer.
## Write with autocomplete
As you type, FlexTable suggests **tables, columns, and keywords** from the live schema.
**PRO for NoSQL queries.** Running typed queries against **MongoDB and Redis** requires a PRO license. Browsing those databases (keys, documents, collection data) is always free. SQL databases run queries for free.
## Open an editor
Click **+** in the tab bar and choose **New Query**, or use the query icon in the sidebar. The editor knows which connection and database the tab targets, shown in the footer.
## Write with autocomplete
As you type, FlexTable suggests **tables, columns, and keywords** from the live schema.
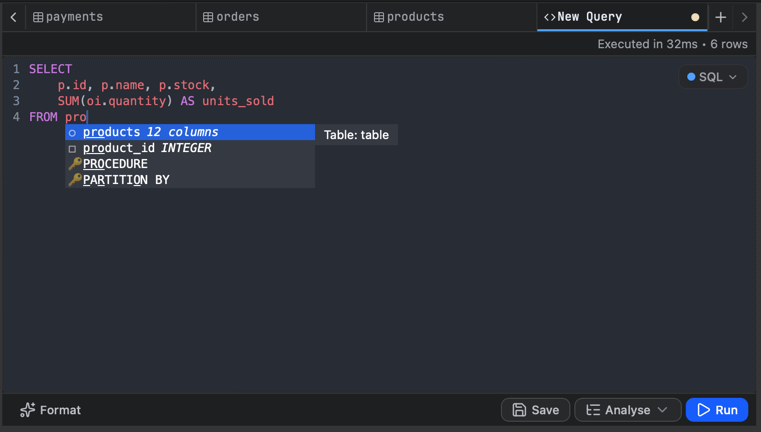 **Schema-aware.** Suggestions come from the database you are actually connected to, so table names, column names, and types are real.
```sql theme={null}
-- PostgreSQL / MySQL / SQLite
SELECT id, email, created_at FROM users WHERE active = true ORDER BY created_at DESC LIMIT 100;
```
```js theme={null}
// MongoDB (PRO)
db.users.find({ active: true }).sort({ created_at: -1 }).limit(100)
```
```
# Redis (PRO)
SCAN 0 MATCH user:* COUNT 100
```
## Format your SQL
Reformat a messy statement into clean, readable SQL with one action, so shared and saved queries stay tidy.
## Run and read results
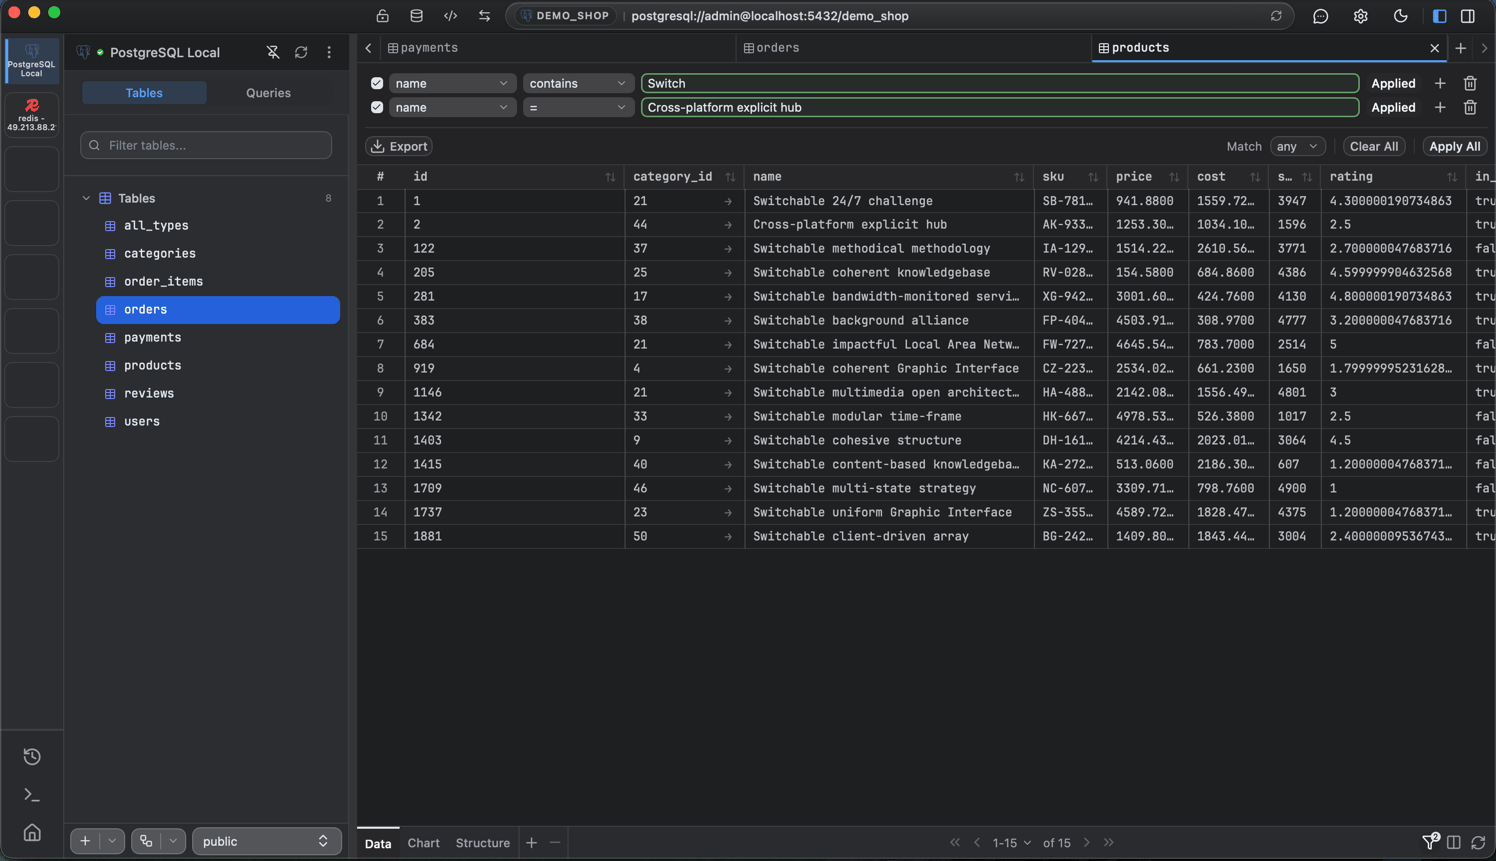
Press **Cmd/Ctrl + Enter** (or the **Run** button) to execute. Results stream into the grid below and large results paginate. The result grid is the same one used for table browsing, so you can **sort**, **filter**, and **inspect** a cell just like a table.
**Schema-aware.** Suggestions come from the database you are actually connected to, so table names, column names, and types are real.
```sql theme={null}
-- PostgreSQL / MySQL / SQLite
SELECT id, email, created_at FROM users WHERE active = true ORDER BY created_at DESC LIMIT 100;
```
```js theme={null}
// MongoDB (PRO)
db.users.find({ active: true }).sort({ created_at: -1 }).limit(100)
```
```
# Redis (PRO)
SCAN 0 MATCH user:* COUNT 100
```
## Format your SQL
Reformat a messy statement into clean, readable SQL with one action, so shared and saved queries stay tidy.
## Run and read results
Press **Cmd/Ctrl + Enter** (or the **Run** button) to execute. Results stream into the grid below and large results paginate. The result grid is the same one used for table browsing, so you can **sort**, **filter**, and **inspect** a cell just like a table.
 **Cancellable.** A long-running query can be stopped; the **Run** button becomes **Stop** while it executes.
## Saved queries and history
**Cancellable.** A long-running query can be stopped; the **Run** button becomes **Stop** while it executes.
## Saved queries and history
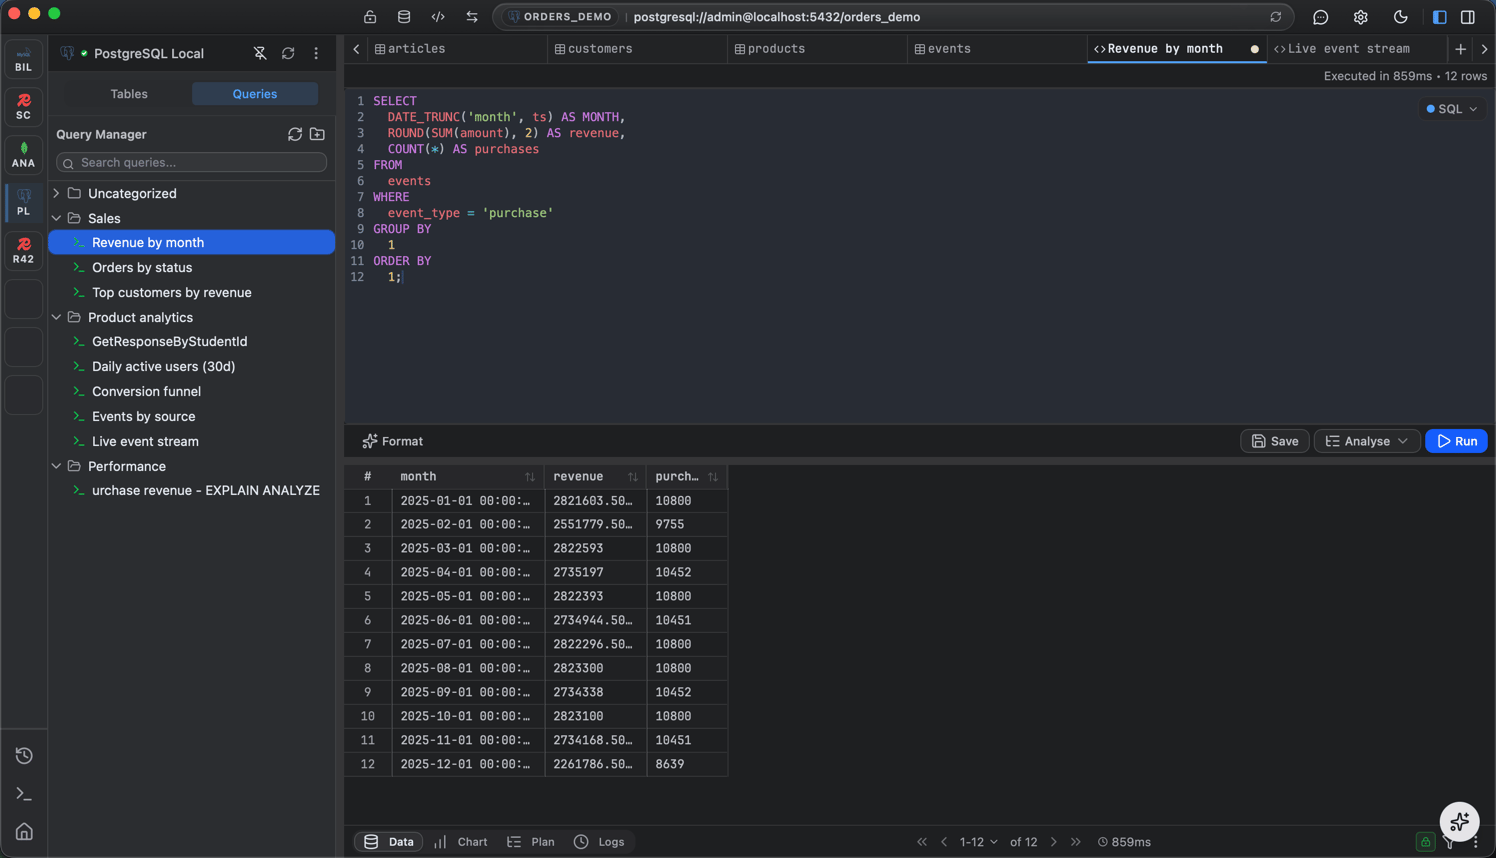 Two separate things:
* **Saved queries** - name and save a query, organize saved queries into **folders**, and reopen them later. Save with **Cmd/Ctrl + S** or the Save action in the editor.
* **Run history** - every query you run is logged automatically, separate from saved queries, with its status, duration, rows affected, and timestamp. Open the **history** view (grouped by date) to copy, re-run, or reopen a past query.
## Visualize and export
* **Chart** - switch the result from **Table** to **Chart** to see it as a bar, line, area, pie, or scatter chart. See [Charts](/charts). Charts are PRO.
* **Export** - save the result as **CSV** or **JSON** (free), or **SQL** and **Excel** (PRO). See [Import and export](/import-and-export).
## Logs
The footer **Logs** tab shows execution details (timing and errors) for the queries you have run.
Two separate things:
* **Saved queries** - name and save a query, organize saved queries into **folders**, and reopen them later. Save with **Cmd/Ctrl + S** or the Save action in the editor.
* **Run history** - every query you run is logged automatically, separate from saved queries, with its status, duration, rows affected, and timestamp. Open the **history** view (grouped by date) to copy, re-run, or reopen a past query.
## Visualize and export
* **Chart** - switch the result from **Table** to **Chart** to see it as a bar, line, area, pie, or scatter chart. See [Charts](/charts). Charts are PRO.
* **Export** - save the result as **CSV** or **JSON** (free), or **SQL** and **Excel** (PRO). See [Import and export](/import-and-export).
## Logs
The footer **Logs** tab shows execution details (timing and errors) for the queries you have run.